

Analytics
Measure automation volume, success, duration, time saved, trends, status distribution, workflow performance, and exception patterns.
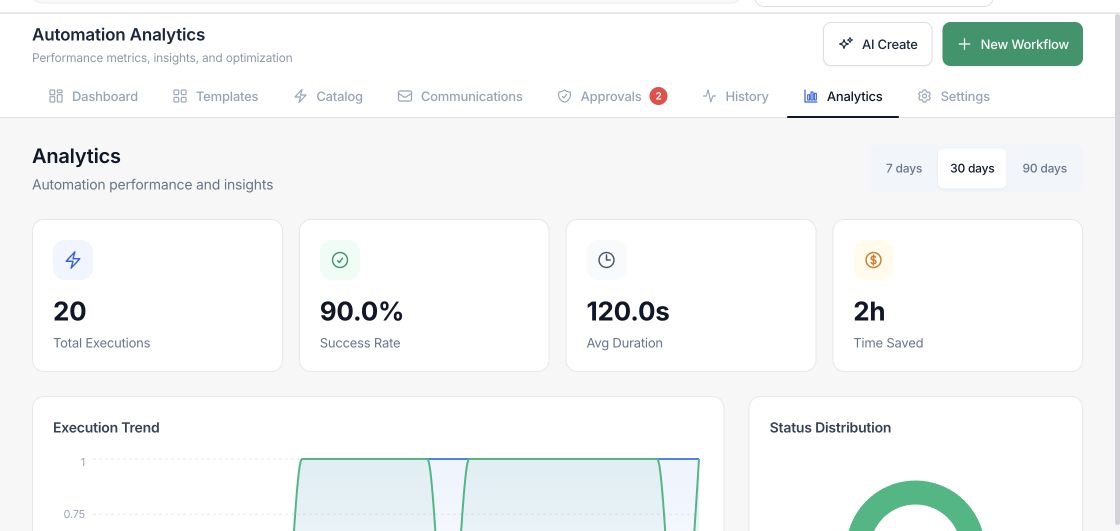
At a glance
The numbers on your screen, explained
What each Analytics number means and where it comes from — so you know where to act.
Runs in the selected time range, currently switchable between 7, 30, and 90 days.
Completed runs divided by total executions in the selected period.
Runs in the selected period that ended in a failed status and may need review.
Estimated time saved from completed executions in the selected analytics range.
Sample numbers from a demo workspace.
Trend
See execution volume over time
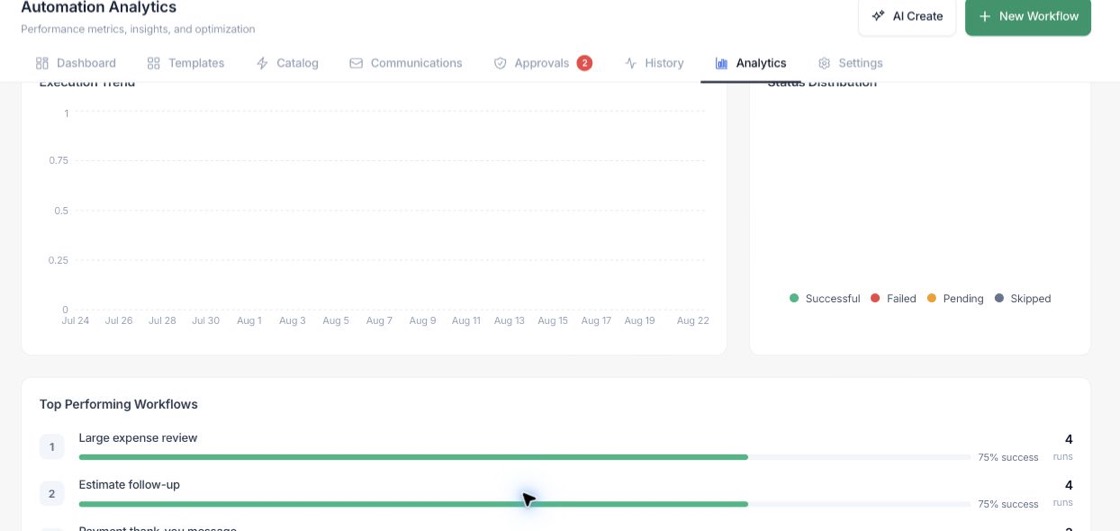
Analytics charts daily executions, successes, and failures so managers can understand automation load and changes across 7, 30, or 90 days.
- Switch between 7, 30, and 90 day ranges
- Compare total executions, successful runs, and failures
- Spot days where workflow volume changed
Quality
Track status distribution and exception rate
The analytics view groups outcomes into successful, failed, pending, and skipped categories so the team can focus on workflows that need attention.
- Success and failure counts feed the status chart
- Pending includes running and approval-waiting runs
- Skipped includes skipped or cancelled work
Improve
Use workflow performance to tune the process
Workflow performance summaries help compare run count and success by workflow, then prioritize templates, steps, or integrations that need cleanup.
- Review top workflows by execution count
- Compare successful runs by workflow
- Exception alerts appear when failures climb
Everything included
Everything in Analytics
Use it for workflow reviews, capacity planning, and improvement prioritization.
Execution trend
Chart run volume over the selected time range.
Status distribution
Break outcomes into successful, failed, pending, and skipped groups.
Average duration
Track how long completed runs take from start to finish.
Success rate
Measure completed runs as a share of total executions.
Workflow comparison
Compare execution count and success by workflow.
Exception warning
Surface failure alerts when exception volume is high.
Range switching
Review the same metrics over 7, 30, or 90 days.
How it works
Analytics, step by step
- 01
Choose the time range
Select 7, 30, or 90 days to match the review cycle.
- 02
Read the KPI cards
Check executions, success rate, average duration, and estimated time saved.
- 03
Review charts and workflow performance
Look for failed-run spikes, slow workflows, or high-volume processes.
- 04
Tune the workflow
Update rules, messages, integrations, or approvals in the builder and monitor the next period.
Connected
Works with the rest of Fratelli
The same records flow between these workspaces automatically.
FAQ
Analytics questions
Can’t find what you need? Our team is happy to help.
The page calculates metrics from automation run data in the selected time range, with workflow summaries where available.
Yes. The page includes 7 day, 30 day, and 90 day range controls.
Yes. Pending counts include running, pending, and approval-waiting states.
Try Analytics with the rest of Fratelli
Start free in minutes and bring the rest of your team when you are ready.